We have been working on the design and implementation of an inclusive self-assessment toolkit that will engage learners themselves – supported by personalized learning analytics – as aspiring research scientists in the important subject of self-regulation and self-determination. The toolkit will engage a broad spectrum of learners in a self-directed, personalized learning process, by enabling learners to set flexible goals and customizable milestones towards achieving those goals based on their unique needs and preferences.
Recently, the design team has been considering alternate entry points into the toolkit, from highly specific to broad and exploratory. Part of this work has been the exploration of new ways of engaging the learner through customizable “touchnotes”, which would afford the learner a quick and easy manual data collection process. A single data point is collected when a touchnote is selected. This can be combined with inputs from automated data collection sources (e.g. from a weather app or a personal health app, etc.), resulting in a fully personalizable data analysis and self-assessment.
The following images show examples of the designs we are currently developing (select to enlarge):

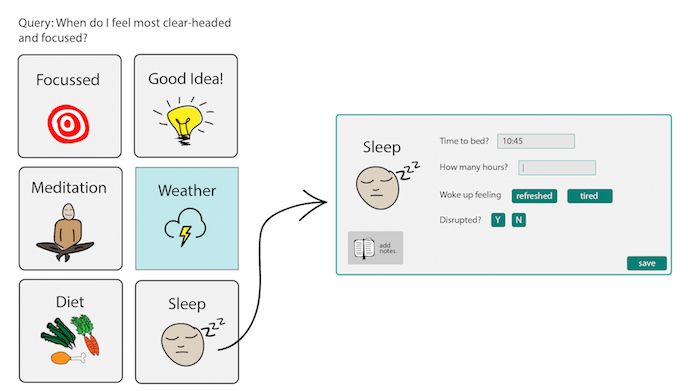
Figure 1. A learner can choose to be prompted for more detailed information when they select a touchnote in their personalized collection.
The image shows a collection of square "touchnotes" buttons on the left with the heading "Query: When do I feel most clear-headed and focused?". The touchnotes in the collection include: "Focused", "Good Idea", "Meditation", "Weather", "Diet", and "Sleep". An arrow points from the "Sleep" touchnote to a dialog box with prompts for more information including: "Time to bed", "How many hours?", "Woke up feeling: refreshed/tired", "Disrupted? Y/N", and an option to add notes to a journal. There is a save button at the bottom of the dialog box.

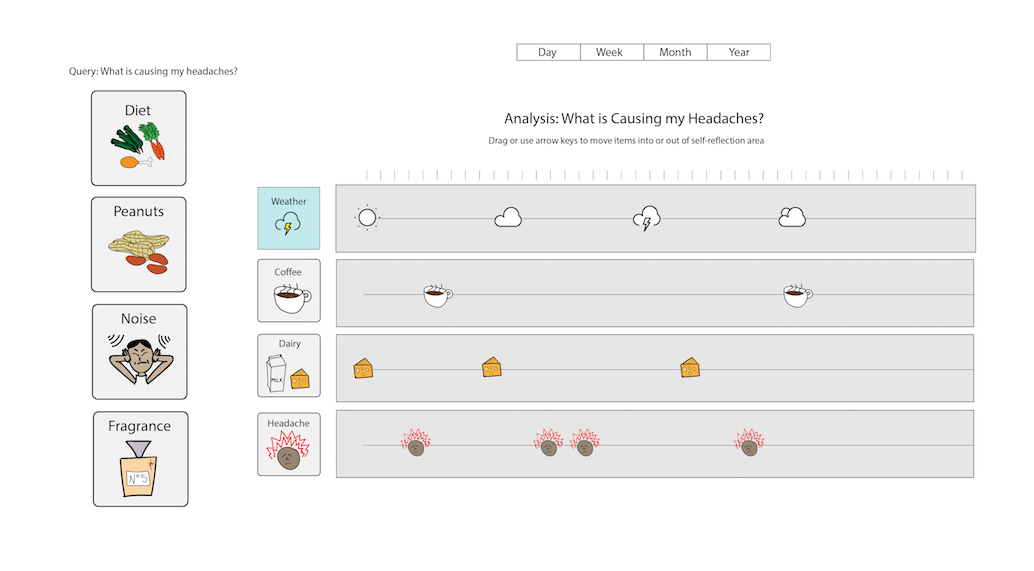
Figure 2. Data collected through touch-notes and automated tracking (e.g. weather) is presented back to the learner in a personalized format.
The image shows a column of touchnotes on the left-hand side, some of which have been dragged into a data analysis area in the middle of the screen; where there is a plot showing 4 horizontal and synchronous "tracks" of touchnote data vs. time. The plot is titled "Analysis: What is causing my headaches?". The data plotted in the analysis includes: "Weather", "Coffee", "Dairy", and "Headaches".

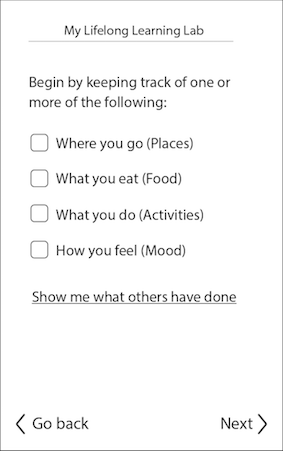
Figure 3. A wireframe of a mobile interface showing a possible exploratory entry point into the self-assessment toolkit. Choices made on this screen will help to guide the learner in setting up their data collection process, including touchnotes.
The image shows a mobile interface screen with text that states "Begin by keeping track of one or more of the following:". This text is followed by a list of checkboxes including: "Where you go (Places)", "What you eat (Food), "What you do (Activities)", and "How you feel (Mood)". This list is followed by an option to "Show me what others have done", with "Next" and "Go back" buttons at the bottom of the screen.